Freight demand is improving in June 2026, but the recovery is exposing a fragile point in the network: drayage and short-haul execution at the end of intermodal moves. Rising intermodal volumes, stronger import flows, routing-guide failures and tighter carrier qualification standards are making local truck capacity more consequential than headline linehaul pricing alone.
- May 2026 freight data from Cass and AAR show a real recovery in truck and intermodal activity, but the rebound is uneven.
- Drayage is emerging as an early bottleneck because local fleets and drivers cut during the downturn have not recovered as quickly as intermodal demand.
- Routing guides are already failing in parts of truckload, with mini-bids and rebids increasing as tender rejections rise.
- National truck availability does not guarantee executable local capacity for port pulls, rail-ramp pickups or appointment-driven final delivery.
- Industrial freight is especially exposed because a missed dray move can trigger demurrage, storage, plant delays and expensive recovery options.
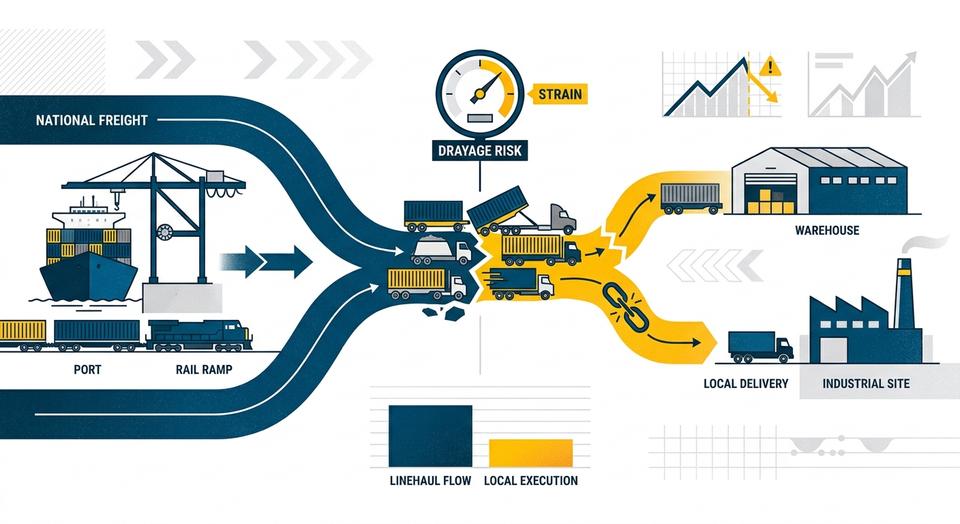
June’s freight recovery is starting to look less like a simple rate story and more like a local-execution problem. As intermodal demand improves and truckload capacity tightens, one of the first weak points to emerge is drayage: the short-haul truck move that connects ports and rail ramps to warehouses, plants, transload sites and jobsites.
That matters because the operational pain shows up at the end of the move. A container can clear the port and ride the rail network on time, yet still miss its delivery window because the local truck, chassis, appointment slot or recovery option is not there when needed. Recent reporting from the Journal of Commerce, FreightWaves, Cass Information Systems, the Association of American Railroads, and gateway operators such as the Port of Los Angeles all point in the same direction: freight demand is improving, but the network is not recovering evenly.
The rebound is real, but it is uneven
CAP has already covered the spring turn in truckload and broader freight repricing. What is newly important in mid-June is where the network is thinning.
The freight backdrop has clearly improved. The Cass Transportation Index report for May 2026 said the shipments component of the Cass Freight Index narrowed to a 1.2% year-over-year decline, the smallest drop in 18 months, while the expenditures component rose 7.5% year over year. Cass also said the Truckload Linehaul Index rose 6.9% year over year in May and that “volumes are beginning to recover, but it is mainly supply constraints supporting higher rates.”
Rail data are telling a similar story. In its June 2026 Rail Industry Overview, the Association of American Railroads said intermodal volume increased 8.1% in May, its fourth straight gain, while rail container traffic reached a record year-to-date high. Earlier, the Intermodal Association of North America said its new Intermodal Volume Index projected April intermodal volume at 103.1, or 3.1% above its pre-pandemic baseline.
At the ports, import activity has also stayed firm enough to keep inland networks busy. The Port of Los Angeles handled 890,861 TEUs in April, up 5.7% from a year earlier and its second-best April on record. Executive Director Gene Seroka said the next wave of imports, including back-to-school and early holiday goods, was already beginning to build. The Port of Long Beach then reported 842,030 TEUs in May, up 31.7% year over year, with imports up 40.8%.
Those are not recession-type volume signals. But they also do not mean service resilience has fully returned.
Why drayage is becoming the first visible bottleneck
The core June development is that stronger linehaul and intermodal demand are exposing shortages in local trucking execution. The Journal of Commerce reported on June 15 that drayage has become a recent weak link in the intermodal supply chain as fleets cut during the downturn now struggle to find enough drivers for the final leg. That thesis is reinforced by market commentary from large intermediaries and public data sources.
C.H. Robinson’s June 2026 drayage update said “inland execution is creating more friction than terminal congestion itself” and that rail disruption, trucking constraints and uneven cargo arrivals are making inland cargo movement less predictable once containers leave the terminal. That distinction is important: a terminal can be fluid while the end-to-end move still fails.
ITS Logistics made the same point in its June Port/Rail Ramp Freight Index, warning on June 12 that all U.S. regions were at elevated concern as capacity exits and rising demand set up downstream congestion and price increases in drayage and intermodal operations. Paul Brashier, vice president of global supply chain at ITS, said, “Ocean and rail container drayage markets may not be feeling the market squeeze yet, but shippers should be prepared for tightening as soon as July.”
In practice, this is where local capacity constraints become expensive. If rail and port flows improve faster than drayage fleets recover, the pressure shifts to:
- container pickup timing and free-time management;
- chassis turns and street-dwell productivity;
- appointment availability at terminals, warehouses and plants;
- transload scheduling;
- same-day or next-day recovery options when the original plan breaks;
- and final-delivery compliance for time-sensitive industrial freight.
The Port of Los Angeles operations report for June 16 offers a useful snapshot of why this matters at the gate level: local cargo dwell was 3.1 days, on-dock rail dwell was 4.5 days, and chassis on-street dwell was 3.5 days for 20-foot equipment and 5.9 days for 40-foot-plus equipment. Those are not crisis numbers, but they do show that container turns still depend heavily on local execution discipline.
Routing guides are already breaking down
The other warning sign is that contract assumptions are starting to fail only months after bids were set.
In a June 15 report, FreightWaves said truckload contract rates established early in the 2026 bid season “aren’t holding.” According to the report, J.B. Hunt executive Spencer Frazier said mini-bid activity has spiked and some shippers have been forced to rebid entire freight books as tender rejections rise. Frazier said routing guides are “falling apart” and that the deterioration accelerated “from March through today.”
FreightWaves tied the problem to structural capacity changes, not just a brief seasonal squeeze. The report said tighter enforcement around driver compliance, cabotage rules and broker-liability concerns is reducing the number of carriers that large shippers and brokers are willing to use. Schneider’s Jim Filter told investors, according to FreightWaves, that the market is being reshaped by stricter driver standards and the Supreme Court’s Montgomery v. Caribe Transport II decision, which widened liability exposure for negligent carrier selection.
That is a truckload story on the surface, but it has direct consequences for drayage and short-haul freight. When routing guides stop performing, freight does not simply reprice in the abstract. It gets pushed into backup networks, mini-bids, asset-based recovery options, expedited local moves and off-guide capacity. For importers and industrial operators, that often means the weakest handoff point becomes the most costly one.
National capacity is not the same as local execution capacity
One of the easiest mistakes in a recovering market is to assume that if trucks still exist nationally, local execution risk must be manageable. That is not how intermodal handoffs fail.
A shipper may still be able to buy truckload capacity in the market. What it may not be able to buy, at the right time and on the original plan, is a compliant port pickup, a same-day rail-ramp pull, a chassis-supported turn, or a short-haul move that meets a warehouse or plant appointment without extra cost.
That gap is becoming more visible because the recovery has been supply-led as much as demand-led. Cass said May’s improvement was driven mainly by supply constraints rather than a major volume surge. ACT Research has also described 2026 as a supply-driven recovery year, with tightening capacity and uneven freight demand. In other words, the system does not need a full-fledged freight boom to create local failures. It only needs enough volume to collide with thinner fleets, fewer drivers, weaker backup capacity and tighter carrier qualification standards.
Why this matters more for industrial freight
Industrial and project supply chains are especially exposed because they depend on precise handoffs, not just average transit times.
A drayage miss can delay imported MRO parts needed for a planned outage, push back receipt of production inputs moving via rail or marine containers, disrupt transload timing for heavy accessories or fabricated components, or force expensive recovery moves for cargo tied to crane appointments, shutdown windows or site-access restrictions. In heavy industry, the cost of the failed handoff is often much larger than the cost of the linehaul itself.
That is why the local leg is becoming a higher-priority risk signal than broad national truck availability. A container sitting one extra day because no appointment-compliant dray truck is available can trigger storage, demurrage, labor rescheduling, missed contractor windows or plant-side idle time. None of those impacts show up neatly in a headline rate index.
Technology and carrier relationships are moving back to the center
The June discussion around truck technology is also telling. The Journal of Commerce reported on June 16 that truck-tech providers are increasingly focused on connecting capacity visibility with relationship management. That fits the market’s current problem set.
In a looser market, procurement can often rely on rate cards, broad routing guides and a wide backup list. In an uneven recovery, those tools lose value unless they are paired with better real-time visibility into which trucks are truly executable, which carriers can meet appointment requirements, and which providers will protect committed freight when spot opportunities rise.
That does not mean technology is the solution by itself. It means execution is becoming more relational and more operationally specific. The strongest networks are likely to be the ones that know which dray carriers have dependable access in a given gateway, where chassis friction is building, which inland ramps are absorbing more volume, and which warehouses are hardest to serve on short notice.
Where the stress is likely to show first
Public market signals suggest the first stress points are likely to be high-volume import gateways and major inland intermodal hubs rather than the national network all at once.
Southern California is an obvious watch point because the cargo is there. The Port of Los Angeles said April imports were up 5% year over year, and the Port of Long Beach said May imports jumped 40.8%. The combination of strong import flow, heavy transloading and large inland rail handoffs means drayage shortages can quickly shift from a pricing issue to an appointment issue.
Chicago and other inland rail hubs also warrant attention because intermodal growth is flowing into rail-connected distribution networks that still depend on local truck turns to finish the move. Neither AAR nor IANA data prove gateway-specific distress by themselves, but together they do support the broader inference that rising intermodal volume will test the local legs first, especially where carriers cut fleets during the downturn and have been slow to rebuild.
What to watch next
The market is not yet in a full-blown intermodal service crisis. Port fluidity in Los Angeles remains solid, and public data do not show a nationwide collapse in dray performance. But June’s reporting strongly suggests the network has become less forgiving.
The practical watch items over the next several weeks are straightforward:
1. Earlier booking for critical dray moves
Critical container pulls, rail-ramp pickups and plant deliveries are likely to require more lead time than they did earlier this year.
2. Free-time assumptions that no longer hold
If pickup timing becomes less predictable, detention, storage and demurrage exposure can rise even when terminal congestion looks manageable.
3. Chassis and appointment availability
A market can appear fluid at the port while still becoming difficult at the warehouse gate or consignee dock.
4. Routing-guide compliance
Rising mini-bid activity, higher tender rejections and off-guide awards would confirm that service resilience is deteriorating faster than annual procurement cycles assumed.
5. Backup options for urgent freight
When the local handoff fails, recovery usually comes from premium local capacity, transload changes, team recovery, or alternate delivery windows. Those options get more expensive as the market tightens.
For CAP Logistics readers, the takeaway is practical rather than dramatic: June’s freight recovery is revealing that the next disruption may happen at the port-to-rail-to-final-delivery handoff, especially for industrial freight that cannot absorb a missed local move. Earlier drayage planning, tighter appointment control and clearer contingency options are becoming more important than broad market averages.
FAQ
Why is drayage becoming a bigger risk in June 2026?
Because freight demand is recovering faster than some local drayage fleets and short-haul driver pools have rebuilt. That makes the final handoff from port or rail to warehouse, plant or jobsite more vulnerable to delays and repricing.
What is the difference between national truck capacity and local execution capacity?
National capacity refers to whether trucks are generally available in the market. Local execution capacity is narrower: it means having the right truck, driver, chassis, appointment slot and compliant carrier available for a specific short-haul move at the required time.
How do routing-guide failures affect intermodal freight?
When routing guides fail, freight is pushed into backup providers, mini-bids or expedited recovery moves. For intermodal shipments, that can make container pickups, rail-ramp turns and final delivery less predictable and more expensive.
Which operations are most exposed to drayage strain?
Time-sensitive industrial operations are especially exposed, including plant shutdowns, imported MRO parts, production inputs, rail-to-truck handoffs, transloads and project cargo components that depend on fixed local delivery windows.